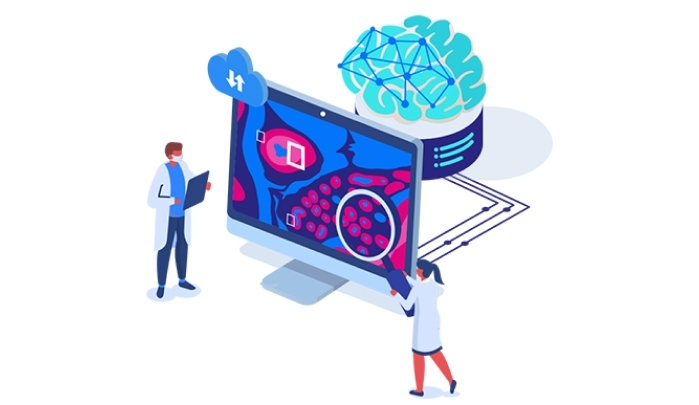
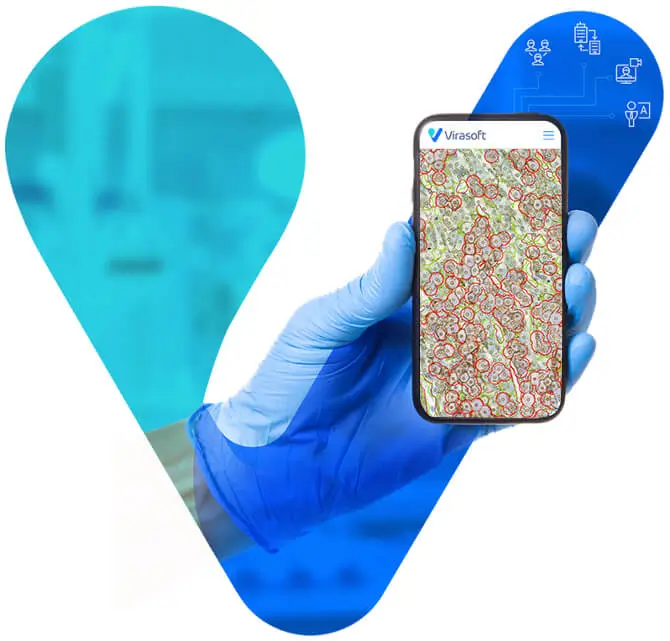
Explore Virasofts advanced academic platforms designed for the future of pathology.
Virasoft’s academic solutions are consisted of:
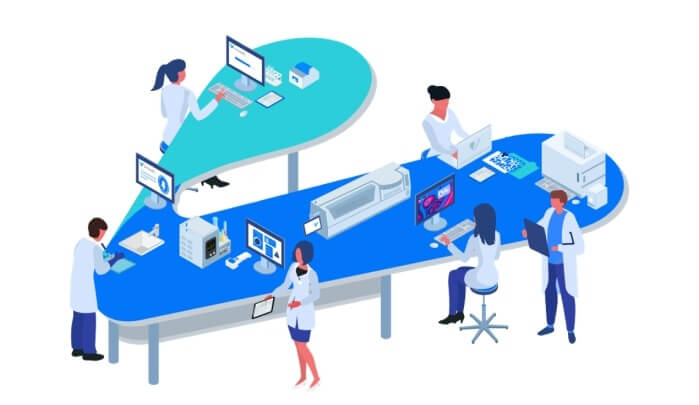
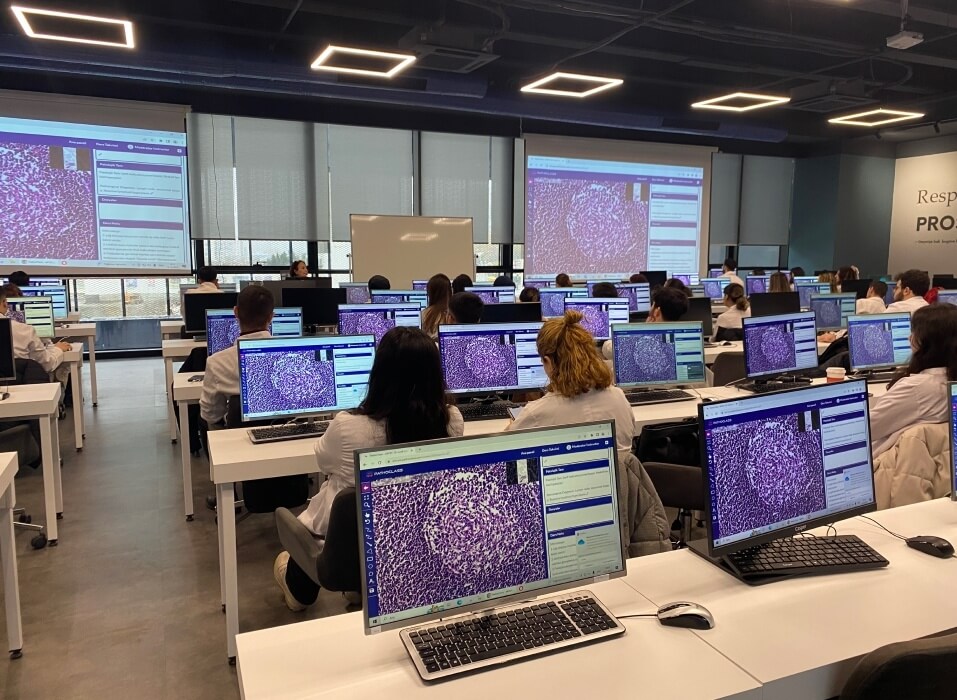
Our academic platforms bring instructors and students together with scanned whole slide images (WSIs), assignments and lectures.


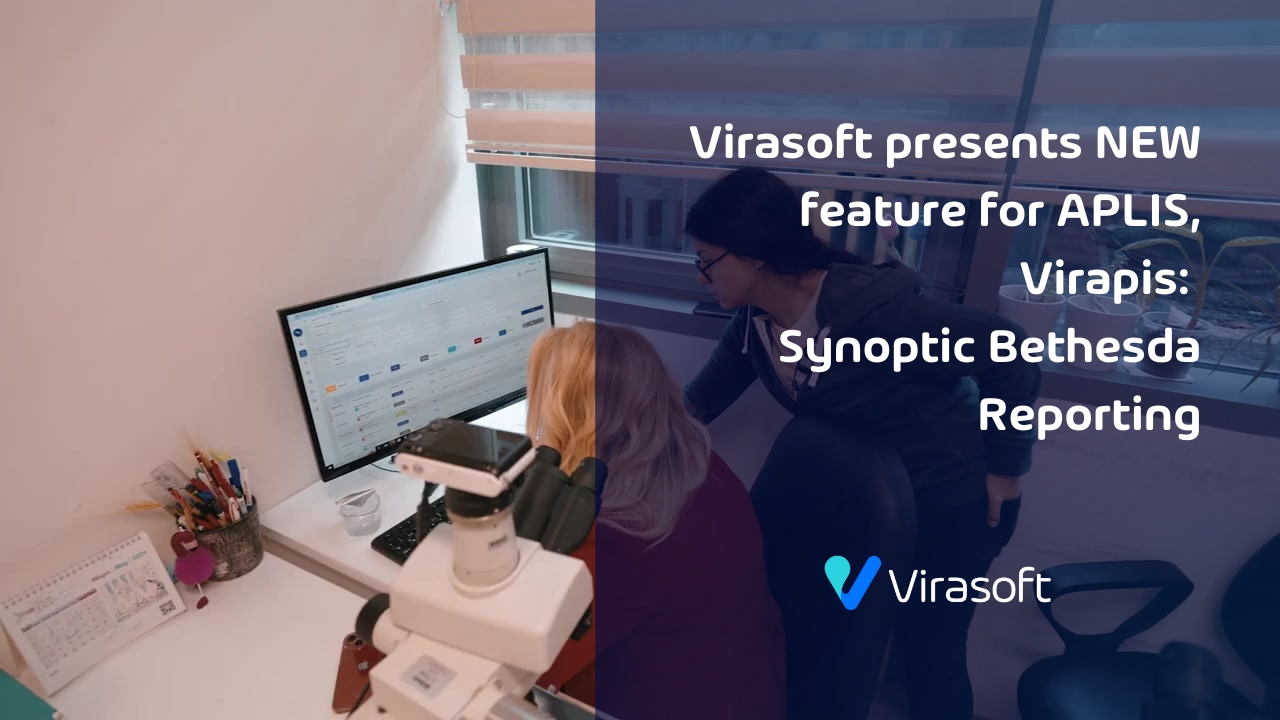
Virasoft Solution: VIRAPIS
Virasoft Solution: VIRAPIS
Virasoft Solution: VIRAPIS
Virasoft Solution: VIRAPIS
Virasoft Solution: VIRAPIS
Virasoft Solution: VIRAPIS
Virasoft Solution: VIRASIGHT
Virasoft Solution: VIRAPIS
Virasoft Solution: VIRAPIS & VIRASIGHT
cases reported
in 2024
algorithms used
in 2024
cases consulted
in 2024
students attended

Virasoft has successfully implemented its digital and AI-driven solutions at Pathoteam Diagnostic, enhancing diagnostic accuracy, workflow efficiency, and collaboration. This partnership marks a significant step in advancing pathology practices with cutting-edge technology.
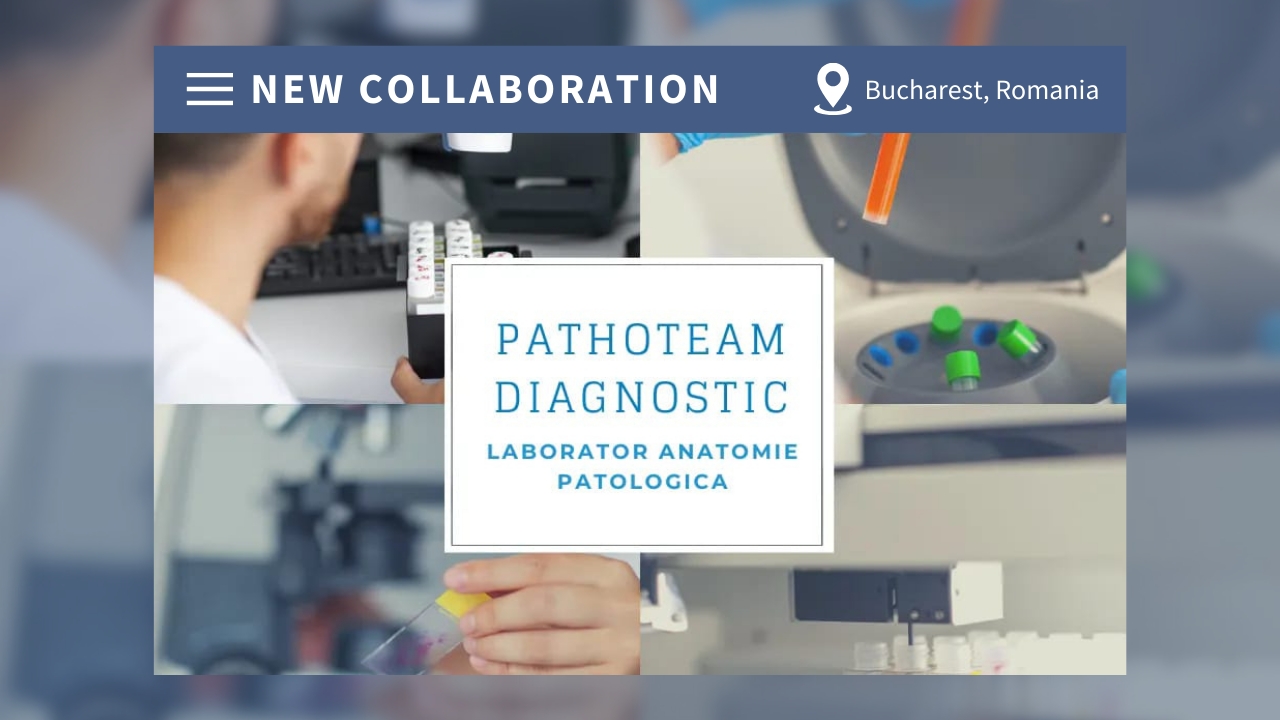
Virasoft and Pathoteam Diagnostic join forces to set new standards in pathology with advanced AI solutions.
This collaboration represents a significant milestone in Virasoft’s mission to provide innovative AI-powered pathology solutions to laboratories around the globe.
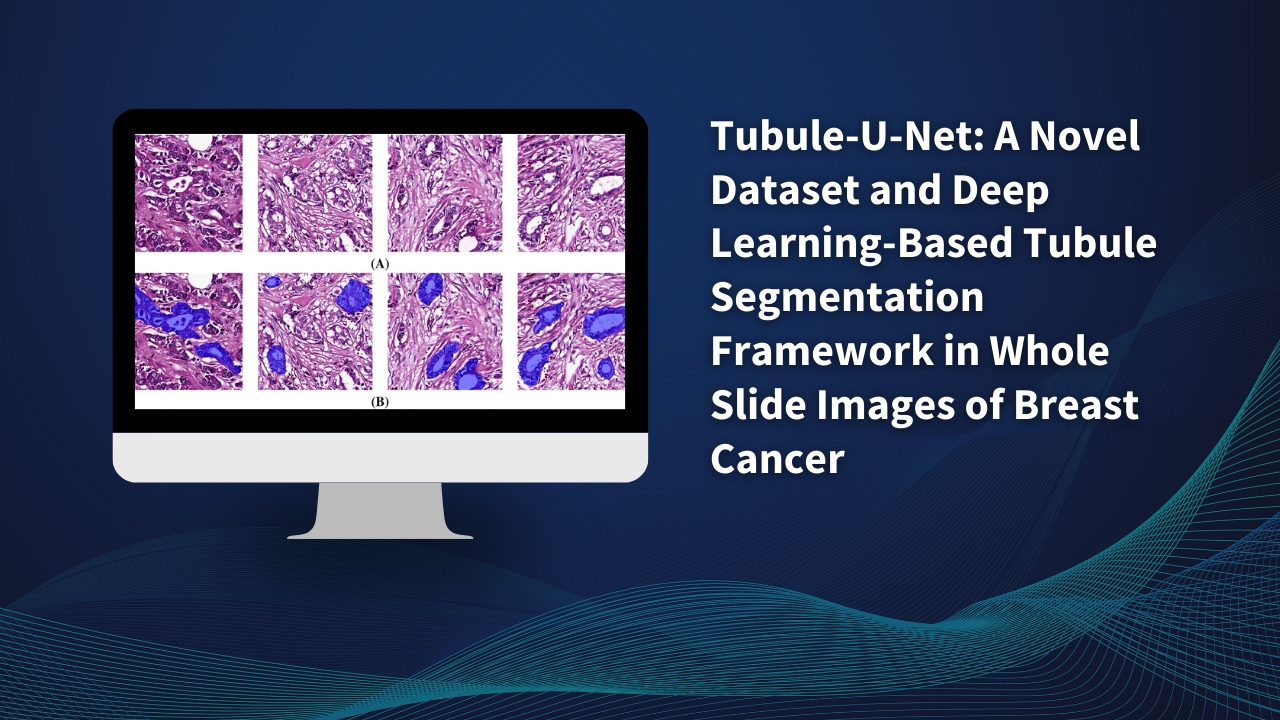
Virasofts research article, "Tubule-U-Net: A novel dataset and deep learning-based tubule segmentation framework in whole slide images of breast cancer," published in Scientific Reports (Nature, 2023), ranked among the top 100 most downloaded cancer research papers of the year.